Parallel transport
Once more, we use the sphere to illustrate how parallel transport works (with the kernel).
![]()
![]()
![[Graphics:../HTMLFiles/index_165.gif]](../HTMLFiles/index_165.gif)
The metric in (![]() ,
,![]() ) coordinates is
) coordinates is
![]()
![]()
![]()
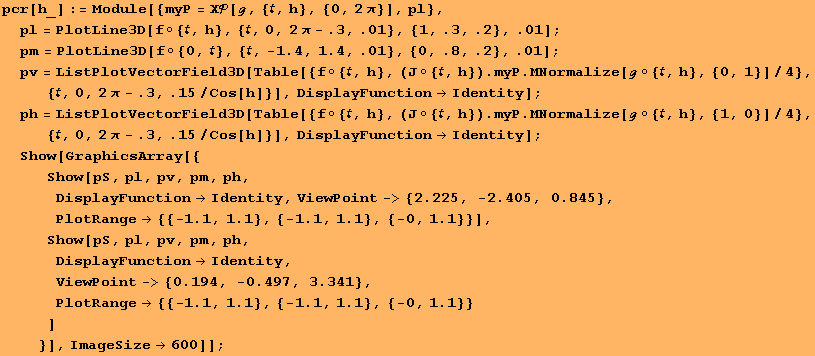
The essential computation is carried out in line 1 of the following code. The command is ΧP[g,{t,h},{0,2 π}]. The input to ΧP is the metric g, a curve γ(t):I→M, and the interval I⊂R.

We plot parallel transport of an orthonormal frame along several meridians.
![]()
![[Graphics:../HTMLFiles/index_173.gif]](../HTMLFiles/index_173.gif)
![[Graphics:../HTMLFiles/index_174.gif]](../HTMLFiles/index_174.gif)
![[Graphics:../HTMLFiles/index_175.gif]](../HTMLFiles/index_175.gif)
An animation is sampled by "AnimationDisplayTime".
![]()
![]()
| Created by Mathematica (December 22, 2006) |